

AUSSIE CYCLE TRADER - Monthly Newsletter for January 2024
AUSSIE CYCLE TRADER - Monthly Newsletter for January 2024
This month we consider if the AUDUSD has a 27 month cycle. Plus the latest market updates and analysis.

Happy New Year to All.
I hope you’ve enjoyed some holiday relaxation and some sunshine over the past few weeks.
Thankyou for those that offered kind words and understanding after last month’s cancelled newsletter following the passing of my sister. December was a whirlwind personally and the markets were the last thing on my mind.
I’ve had a solid month out of the charts, and it’s time to open them again and see where we have got to. Starting with fresh eyes is not necessarily a bad thing!
And with that said, let’s get straight to business. Both the ASX and AUD/USD have been strong since our last newsletter. In fact the XJO got within a whisker of all time highs.
Both markets also have intermediate cycle lows due, so we’ll consider whether those lows are in.
I hope you enjoy this month’s newsletter.
Best regards,
Jonathan R.
PS. These newsletters constantly reference various cycle lengths and characteristics. Cycle theory is assumed knowledge, and to a lesser degree, geocosmics. For more background info on cycles and geocosmics, see this link.

Disclaimer:
All information provided is based on analysis of the markets using publicly available information and data. It is provided for your own review and study with no consideration of your personal circumstances. Trading markets always involves risk. No guarantees are made. You are solely responsible for any transactions you initiate in the market.
Review of the AUDUSD currency pair
The AUDUSD made a 12 month low at $0.6271 last October 26. The market reversed and the subsequent rally was strong, moving 9.6%, exactly 600 points, over the a 7 week period to $0.6871 on 28 December. From there it has lagged, failing to take out the previous Primary Cycle High just below $0.69.
Long Term Outlook
The AUDUSD has made consistent 6.8 year cycles since 1971 when it floated. These cycles form the greater 17 year cycle, in either 2 expanded phases, or 2 normal phases and a shortened 3rd phase.
We are currently in the first phase of a new 17 year cycle which commenced from the Covid crash of March 2020. Being early in the new 17 year cycle, we expect bullish trends overall. This hasn’t been evident though. The rally lasted just 11 months to it’s high at $0.80 and has been trending down the next 35 months.
Currently the price is trading between the Covid low and current Cycle high. Being below both moving averages, with the faster below the slower moving average, we can classify the monthly chart as ‘bearish’.

Intermediate Outlook
Ever since I started studying the AUDUSD, I’ve been quite comfortable that the 6.8 year cycle breaks down into 2 phases of 46 months, or just under 4 years. We have 9 cases of this cycle since 1971, and observed a range of 39-52 months in 7 of those. It isn’t a statistically significant number of occurrences, but correlates with many other markets that have 4 year cycles, and has been reliable over a long period of time.
The shorter phasing is the 23 month cycle - two of these give us the 46 month. The 23 month cycle has 2 phases of 47 weeks.
We are currently in the orb period for both the 46 month and the 23 month cycles. It appears we have completed 47 week cycle on October 26.
The current market position provides a challenge in our intermediate cycles. The low from 13 October 2022 is a significant one, and it occurred at the 31 month mark, 8 months before the orb period. It occurred in the middle of a bearish 23 month cycle, which as we know breaks a rule for bearish cycles - the lowest point in a bearish cycle must be at the end.
There are multiple possible scenarios to consider as a result:
The 46 and 23 month cycles may have contracted, completing in October 2022. If so, we are in month 15 of newer cycles. We would have a bullish bias in this scenario.
The 46 and 23 month cycles may still be due to complete. The orb for the current 23 month cycle concludes at 26th April 2024 and must result in final low below $0.6170. We would be bearish in this scenario. We also note that a new 47 week cycle commenced on 26th of October and would most likely form a contracted bearish 3rd phase to our older 23 month cycle.
The 6.8 year cycle may be exhibiting 3-phases of 27 months. If so, the October 2022 low concluded the first phase right on time.
Let’s now consider our options. Firstly, does the AUDUSD have a 27 month cycle? The answer is yes. Just us Primary Cycles have can have combinations of 2 and 3 phases, the longer term cycles can also combine with 2 and 3 phases. In the case of the AUDUSD, if you look for 3 phases to the 6.8 year cycle, it is particularly evident from 1986 onwards. Some deeper analysis reveals that it is actually a 29 month cycle with a normal range of 23-35 months.
Do we therefore discard the 46 month cycle?
To me the answer is no. The 46 month cycle has been reliable ever since the AUDUSD floated and we don’t need to throw out the analysis because a second phase of this cycle hasn’t unfolded exactly as expected.
Let’s put the 29 month cycle to one side then. Note that the 47 week cycles we are using would be valid as 3-phase to the 29 month cycle, so it doesn’t change our approach all that much.
The longest recorded 46 month cycle expanded to 52 months, which takes us to mid-July 2024. We therefore have until then to confirm that older 46 and 23 month cycles are still in place. Narrowing further, the older 23 month cycle has an orb that concludes on April 26.
The simple confirmation for point 1 to hold true is to watch for a drop below $0.6170 between now and July, but more likely by April.
If the market rallies beyond $0.69, particularly as we approach the end of these orbs, Scenario 2 will appear the better labelling.
Well done if you are still with me. I acknowledge the analysis this month is like a labyrinth of market patterns!
To conclude our intermediate cycles, the market is trading below both moving averages on the weekly chart, and the faster moving average is below the slower. This is therefore classified bearish.

Primary Cycle
We are in Week 12 of the Primary Cycle, just beyond the mid-point. The Primary Cycle topped out in Week 9 at $0.6871, and if this cycle is bullish we can expect new highs in the second half of this cycle.
It appears that the cycle is unfolding in a 3 phase pattern and the 2nd phase has its orb period from now to 8 February. This is the time to wait for confirmation of the major bottom low and a buying opportunity.
We noted in our intermediate analysis that for the next few months there is possible (though uncertain) bearish action ahead, so trade with caution. The short term signals to look for are outlined below.

Trading Strategies
For now it’s fine to remain long in this market. Some early bearish indicators would be if the low of $0.6526 is taken out as the 2nd major bottom is forming (ie the 2nd major cycle low is lower than the first). The low is due by Febuary 8. If followed by a weak rally that fails to make a new Primary Cycle high, this would be a second bearish indicator and give you the signal for an early exit. As the primary cycle matures traders will look to offload longs and reverse position, shorting the 3rd and final phase of the Primary Cycle. A key resistance level is the form Primary Top at $0.6899, or round to $0.6900 (round numbers often provide support and resistance on the AUDUSD).
AUDUSD Geocosmics
The following are calculated using studies of historical market correlations to various geocosmic signatures. The CRD calculations are from Ray Merriman's works, while the others are my own studies based on similar methods. The strongest reversal patterns will involve CRD's in combination with solar lunar or ingress dates per below.
Upcoming Critical Reversal Dates (CRD's) allowing +/- 2 trading days:
13 January
29 January
9 February
16 February
Note: CRD's can be crests or troughs, +/- 3 trading days may be used for higher correlation to reversal dates.
Upcoming Solar/Lunar dates:
17-18 January (trough only)
24-25 January (trough only)
31 January - 2 February (trough only)
5-6 February (crest or trough)
16 February (crest or trough)
These dates have been calculated as having above average probability for a 2.5% or greater reversal.
Additional studies on the AUDUSD show that there is a higher-than-average chance of 8% or greater reversal when the Sun is at an Ingress (0 degrees) or midpoint (15 degrees) of signs. In particular, the signs of Leo, Virgo, Libra, Scorpio and Aquarius. The dates to watch for this month are:
22 January
5 February
20 February
Allow +/-2 trading days.
The best turning dates will occur for significant overlaps of the various dates above.
Review of the ASX S&P200
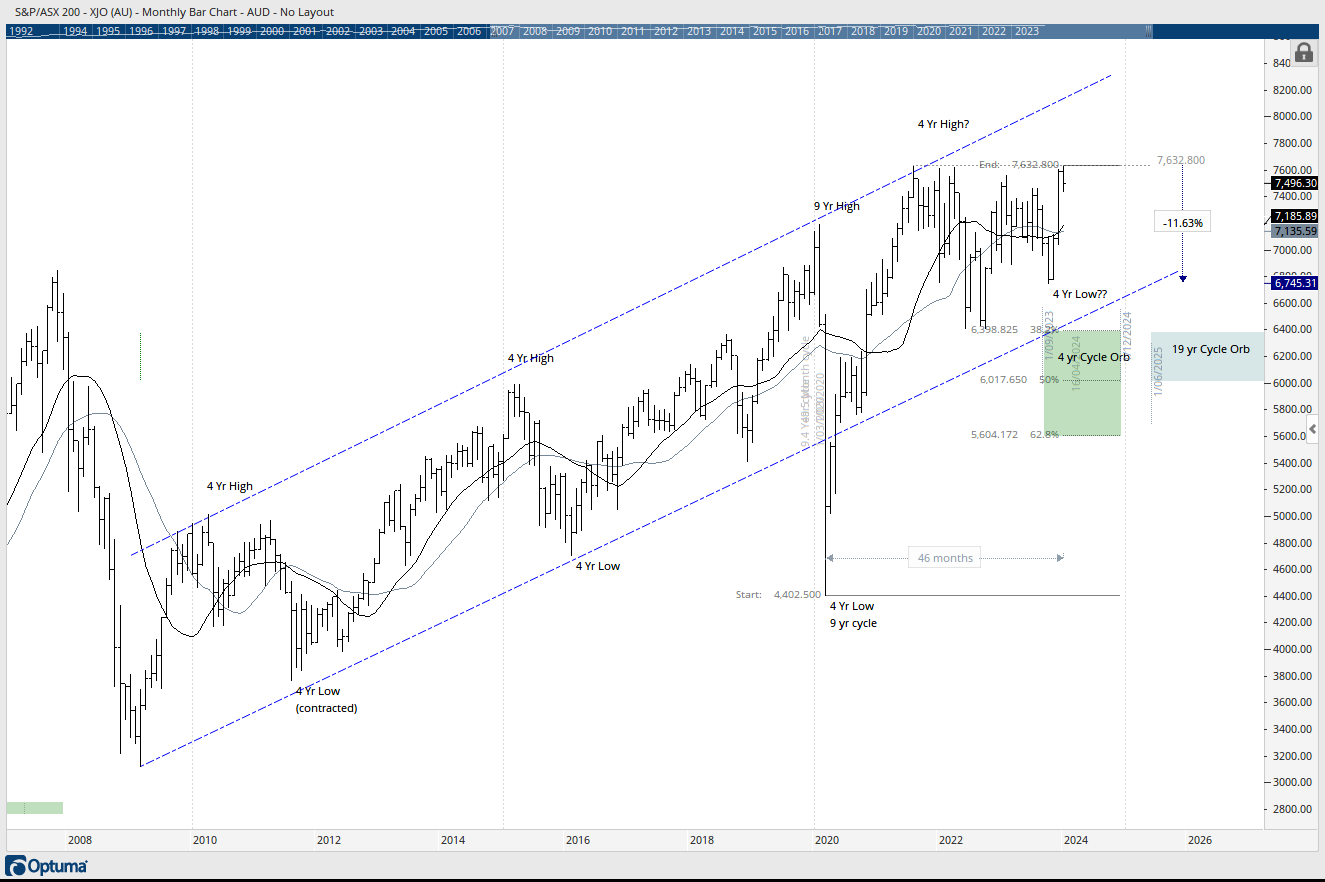
The XJO made a low on 30 Oct at 6,751 before reversing and rallying strongly - 13% before testing the all time high on 2nd January. At the time of writing the market has pulled back 2.5% and bulls are no doubt waiting in anticipation to see if new ATH’s are imminent.
Long Term Outlook
The XJO has been in it’s 50-month cycle orb since September 2023. With the strong rally from the October 2023 low, we must consider if the 4 year low is already in.
Since the great depression low in 1931, only 5 of 23 cycles had a dip of 12% or less on this cycle length. If the latest cycle is complete, we’ve just witnessed the 6th occurrence, with a drop of 11.6% from it’s high.
Technically, the rules are met for the completion of this 4-year cycle. If so, expect strong rallies in the months ahead. But note that the orb period is in place until December 2024 so there is ample time for new highs AND new lows in the older 4-year cycle.
The faster MA has now inverted above the slower one and price well above both, so the market is categorised bullish. We’d like to see the All Time High taken out in order to confirm this further.
It should be noted that the XAO has not tested it’s all time high in the same way as the XJO - suggesting an investor weighting towards the larger stocks that make up the Indices. If the XAO fails to take out it’s high while the XJO does (ie. a divergence between related markets), then we could still have lingering doubts about the overall market strength. Conversely, new all time highs in both markets are sign of strength.
That’s something to keep our eye on!
Intermediate Outlook
The 55-Week Cycle completed at the 30 October low at 6,751.30. From the Prior cycle, this represents an expansion to 71 weeks, though only 56 weeks from the double bottom low in October 2022.
Since we may have completed the 4-year cycle at the recent low, logically the 22 month cycle would also be complete. If so, it has concluded at month 16, just outside the normal 17-26 month range.
But, the alternate scenario is that we are still in an older 4 year cycle, and if this is the case expect the new 55 week cycle to complete both the 4-year and 22-month cycles.
How do we know which scenario to favour? Are we in an old 4-year cycle waiting for it to conclude or new one that should bring some strong bull markets?
The bullish strength of market will confirm it for us.
Going back again to 1931, if we remove the unusual outlier cycles of 1942 and 1974, the minimum rise to a 4-year peak was 35% and the average rise was 80%!
If we are in a new 4-year cycle, expect a big run for the XJO to at least 9,200 (35% gain) and probably a lot higher.
Based on this, I’d want to see the ATH’s for the XJO and the XAO comprehensively taken out with weekly and monthly market closes. Until that happens, my bias is for a final 55 week cycle, potentially distorted, as the longer cycles conclude.

Primary Cycle
The most recent Primary Cycle was a contracted, 16 week cycle, finishing earlier than the normal 18-26 week range.
Notably, 3 of the last 4 Primary cycles have not contracted, finishing earlier than the expected range. Valid cycle lengths fall within range at least 70% of the time, so having 3 of the last 4 being ‘exception’ cycles does make our trading harder. A cycle that completes earlier than expected can result in a trader trying to short the market when they should be long.
Does it mean that our expected cycle lengths have changed? And should we adjust our approach to compensate?
In my opinion, the answer is no. For the XJO, in the last 51 Primary Cycles, 11 have concluded earlier than 18 weeks. In other words, 20% of Primary Cycles finish before week 18. That warrants awareness, but our 18-26 week range still holds over the long run. Even with these exceptions, more than 70% of the cycles unfold in our expected range.
The market tested the ATH in Week 9… just prior to the cycle midpoint. To confirm bullish, a new high beyond the midpoint is needed. The current cycle is 2 phase, and we can therefore anticipate a 1/2 Primary Cycle low prior to end of January followed by a rally.

Trading Strategies
In the current falling market, traders should look for the 1/2 Primary Cycle low, paying attention to January CRD’s and solar-lunar dates. Once the low is confirmed expect a rally which may test the ATH. Failure to take out the ATH is a sign of weakness for the current cycle, while a breakout through the ATH is a sign of strength. Being long in this market is okay, as it is falling into resistance zones. Watch previous highs at 7,341, and Fibonnaci levels as marked on the daily chart. Look to go long once the 1/2 Primary Cycle low is confirmed with a stop under the low. It would be prudent to take some profit before the ATH is retested if your risk management allows.
XJO Geocosmics
Upcoming Critical Reversal Dates (CRD's) allowing +/- 2 trading days:
13 January
29 January
9 February
16 February
Note: CRD's can be crests or troughs, +/- 3 trading days may be used for higher correlation to turning dates.
Upcoming Solar/Lunar dates:
19 January (crest or trough)
24-25 January (trough only)
29-30 January (trough only)
31 January - 1 February (crest only)
5-6 February (trough only)
12-13 February (trough only)
These dates have been calculated as having higher than average probability for a 4% or greater reversal.